Most businesses want AI-driven insights, AI readiness framework, automation, and predictive decision-making. Far fewer are prepared for the operational work that has to happen before any of that becomes reliable.
That gap shows up fast. Leadership often assumes AI will organize the chaos like disconnected spreadsheets, outdated platforms, and inconsistent reporting, automatically. In reality, AI exposes that chaos faster than it fixes it.
Pacific AI’s 2025 Governance Survey found that 75% of organizations have established AI usage policies, yet only 36% have adopted a formal governance framework. A policy isn’t readiness. It’s a starting point most companies never build past.
Readiness Starts Before the Platform Decision
The biggest misconception about AI adoption is that readiness begins when a company selects the right vendor.
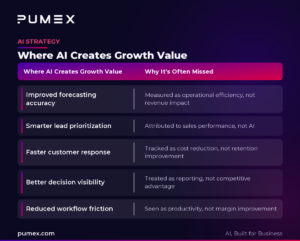
It doesn’t. Readiness starts with operational clarity: where critical data lives, which systems interact, how workflows move across departments, and who owns the metrics that matter. Without that foundation, AI systems generate outputs that look precise and are quietly wrong.
McKinsey’s November 2025 research found that 88% of organizations now use AI in at least one business function, up from 78% the year before, but nearly two-thirds remain stuck in experimentation or pilot stages. Adoption is outpacing governance almost everywhere.
What Fragmentation Actually Looks Like
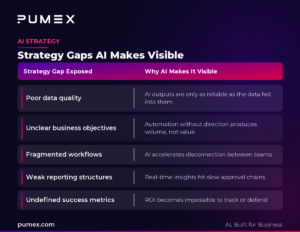
Most businesses discover the scale of their data fragmentation only after AI implementation begins. Duplicate customer records. Departments using conflicting metric definitions. Incomplete historical data. Manual reporting processes that quietly drift out of sync with each other.
These problems exist quietly for years during normal operations. AI doesn’t create them, it just makes them impossible to ignore, because automation depends on consistency in a way manual processes never did.

A Practical Readiness Framework
Businesses that get this right tend to follow a structure, not a sprint.
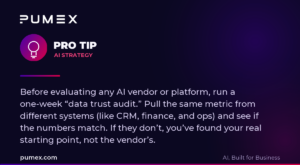
- Audit existing data sources. Review CRM systems, financial platforms, and workflow tools to find where inconsistencies live before automation scales them further.
- Standardize operational metrics. Departments routinely define the same KPI differently. AI cannot reconcile that ambiguity; it will simply automate it.
- Improve integration between systems. Disconnected platforms create disconnected insights. Visibility across sales, support, and operations must exist before AI can meaningfully connect them.
- Establish governance and ownership. Define who owns the data, who reviews AI outputs, and what level of human oversight stays in place. The 2026 Data and Privacy Benchmark Study found 75% of organizations report having a dedicated AI governance process, but only 12% describe it as mature.
Readiness Is Operational Discipline, Not Technology
MIT Sloan Management Review consistently finds that organizations generating sustainable AI value combine technology adoption with workflow redesign and organizational learning.
The pattern holds across every recent governance study: the businesses scaling AI successfully build structure before they build automation. They treat readiness as infrastructure, not a checkbox before deployment.
That distinction is what separates AI that becomes a long-term advantage from AI that becomes another disconnected layer competing for attention inside an already complicated stack.
Fundamentals First, Automation Second
AI readiness isn’t created by purchasing software faster than competitors. It’s built through operational discipline: clean data, clear ownership, and governance that gets reviewed.
The organizations seeing the strongest long-term AI outcomes aren’t the fastest adopters. They’re the ones who got the fundamentals right before scaling. If that audit hasn’t happened at your organization yet, it’s worth doing before the next AI initiative, and not after.
Pumex can help map where the gaps are.
References:
- Pacific AI 2025 AI Governance Survey
- McKinsey: The State of AI in 2025, November 2025
- Cisco 2026 Data and Privacy Benchmark Study, January 2026
- Gartner Data Lineage and AI Risk Management Research
- MIT Sloan Management Review
- Deloitte AI Governance and Enterprise Transformation